SALES AND PRICE ACTIVITY REGIONAL
ppm4rent • April 3, 2018
SALES AND PRICE ACTIVITY (SFH Homes)
Regional/ Sales Data and Condo Sales Data Not Seasonally Adjusted
February-18
Median Sold Price of Existing Single-Family Homes
Sales
State/Region/County
Feb-18
Jan-18
Feb-17
Price MTM% Chg
Price YTY% Chg
Sales MTM% Chg
Sales YTY% Chg
CA SFH (SAAR)
$522,440
$527,780
R
$480,270
R
-1.0%
8.8%
3.3%
5.4%
CA Condo/Townhomes
$461,400
$433,160
R
$407,100
R
6.5%
13.3%
5.5%
-2.4%
Los Angeles Metropolitan Area
$497,730
$492,450
$454,520
R
1.1%
9.5%
-7.3%
-2.5%
Inland Empire
$352,570
$349,710
$327,440
R
0.8%
7.7%
-3.6%
-1.2%
S.F. Bay Area
$893,690
$809,900
$784,470
10.3%
13.9%
7.5%
7.1%
S.F. Bay Area
Feb-18
Jan-18
Feb-17
Price MTM% Chg
Price YTY% Chg
Sales MTM% Chg
Sales YTY% Chg
Alameda
$832,000
$840,000
$786,000
-1.0%
5.9%
5.4%
6.8%
Contra Costa
$610,000
$555,000
$554,250
9.9%
10.1%
0.7%
11.2%
Marin
$1,371,000
$1,317,500
$1,174,500
4.1%
16.7%
1.2%
1.2%
Napa
$713,500
$662,000
$660,000
7.8%
8.1%
-7.9%
18.6%
San Francisco
$1,730,000
$1,330,000
$1,276,000
30.1%
35.6%
8.6%
-4.7%
San Mateo
$1,610,000
$1,437,500
$1,352,000
12.0%
19.1%
30.2%
16.1%
Santa Clara
$1,383,500
$1,170,000
$1,100,000
18.2%
25.8%
19.3%
5.7%
Solano
$430,000
$425,000
$382,500
1.2%
12.4%
8.0%
3.1%
Sonoma
$689,000
$670,000
$598,640
2.8%
15.1%
-5.5%
3.9%
Southern California
Feb-18
Jan-18
Feb-17
Price MTM% Chg
Price YTY% Chg
Sales MTM% Chg
Sales YTY% Chg
Los Angeles
$527,280
$564,100
$470,200
R
-6.5%
12.1%
-6.0%
-3.9%
Orange
$805,380
$780,000
$745,000
3.3%
8.1%
5.0%
-1.0%
Riverside
$396,250
$397,250
$367,250
-0.3%
7.9%
1.7%
-0.8%
San Bernardino
$278,000
$277,000
$265,000
R
0.4%
4.9%
-11.2%
-2.0%
San Diego
$605,000
$590,000
$559,950
2.5%
8.0%
4.7%
-3.9%
Ventura
$609,000
$660,720
$582,500
R
-7.8%
4.5%
-17.7%
-7.1%
Central Coast
Feb-18
Jan-18
Feb-17
Price MTM% Chg
Price YTY% Chg
Sales MTM% Chg
Sales YTY% Chg
Monterey
$590,000
$571,500
$535,000
3.2%
10.3%
-8.2%
7.7%
San Luis Obispo
$605,000
$565,000
$556,000
7.1%
8.8%
-21.9%
-4.3%
Santa Barbara
$755,000
$567,000
$844,000
33.2%
-10.5%
1.3%
16.7%
Santa Cruz
$800,000
$790,000
$799,000
1.3%
0.1%
-23.5%
-9.3%
Central Valley
Feb-18
Jan-18
Feb-17
Price MTM% Chg
Price YTY% Chg
Sales MTM% Chg
Sales YTY% Chg
Fresno
$265,000
$245,450
R
$230,000
R
8.0%
15.2%
4.0%
5.7%
Glenn
$219,600
$228,500
$181,500
-3.9%
21.0%
-31.3%
-8.3%
Kern
$237,000
$225,500
$218,000
5.1%
8.7%
3.4%
4.2%
Kings
$215,000
$238,000
$222,500
-9.7%
-3.4%
-11.1%
-17.9%
Madera
$255,000
$275,000
$230,000
R
-7.3%
10.9%
17.6%
-55.6%
Merced
$267,850
$257,000
$231,000
4.2%
16.0%
2.8%
31.0%
Placer
$472,370
$446,000
$435,000
5.9%
8.6%
-0.6%
0.0%
Sacramento
$350,000
$350,000
$324,900
0.0%
7.7%
0.4%
11.4%
San Benito
$545,000
$555,000
$517,500
-1.8%
5.3%
-18.6%
-7.9%
San Joaquin
$365,000
$350,000
$314,730
4.3%
16.0%
-4.8%
9.4%
Stanislaus
$300,000
$295,000
$270,500
1.7%
10.9%
-5.9%
-4.5%
Tulare
$225,000
$215,730
$216,500
4.3%
3.9%
-0.4%
3.5%
Other Counties in California
Feb-18
Jan-18
Feb-17
Price MTM% Chg
Price YTY% Chg
Sales MTM% Chg
Sales YTY% Chg
Amador
$318,500
$330,000
$265,000
-3.5%
20.2%
15.2%
65.2%
Butte
$297,000
$314,750
$290,000
-5.6%
2.4%
0.0%
-6.1%
Calaveras
$311,500
$306,500
$294,500
1.6%
5.8%
7.5%
22.9%
Del Norte
$216,500
$198,500
$265,000
9.1%
-18.3%
-10.0%
28.6%
El Dorado
$468,000
$480,000
$419,500
-2.5%
11.6%
-5.0%
24.3%
Humboldt
$291,700
$300,000
$297,500
-2.8%
-1.9%
-7.0%
17.6%
Lake
$234,500
$279,000
$230,000
-15.9%
2.0%
-7.4%
8.7%
Lassen
$280,000
$217,750
$171,000
28.6%
63.7%
-35.0%
44.4%
Mariposa
$357,000
$276,500
$335,000
29.1%
6.6%
37.5%
-26.7%
Mendocino
$420,000
$425,000
$381,500
-1.2%
10.1%
-26.3%
-9.7%
Mono
$830,000
$480,000
$520,880
72.9%
59.3%
80.0%
50.0%
Nevada
$400,000
$382,000
$390,000
4.7%
2.6%
33.3%
28.0%
Plumas
$261,500
$265,950
$210,000
-1.7%
24.5%
-30.0%
16.7%
Shasta
$255,000
$249,000
$235,000
2.4%
8.5%
-2.6%
7.4%
Siskiyou
$200,000
$193,000
$240,000
3.6%
-16.7%
-17.5%
43.5%
Sutter
$283,500
$284,200
$269,120
-0.2%
5.3%
8.3%
69.6%
Tehama
$189,000
$227,500
$225,000
-16.9%
-16.0%
3.1%
73.7%
Tuolumne
$274,000
$265,000
$287,500
3.4%
-4.7%
-25.5%
-14.6%
Yolo
$397,500
$383,000
$372,000
3.8%
6.9%
6.2%
-4.4%
Yuba
$269,000
$265,360
$256,500
1.4%
4.9%
5.2%
-11.6%
Note: The MLS median price and sales data in the table below are generated from a survey of more than 90 associations of REALTORS® throughout the state, and represent statistics of existing single-family detached homes only. sales data are not adjusted to account for seasonal factors that can influence home sales. Movements in sales prices should not be interpreted as changes in the cost of a standard home. Median prices can be influenced by changes in cost, as well as changes in the characteristics and the size of homes sold. Due to the low sales volume in some areas, median price changes may exhibit unusual fluctuation.
Los Angeles Metropolitan Area is a 5- region that includes Los Angeles , Orange , Riverside , San Bernardino , and Ventura
S.F. Bay Area has been redefined to include the following counties: Alameda, Contra Costa, Marin, Napa, San Francisco, San Mateo, Santa Clara, Solano, and Sonoma
Inland Empire includes Riverside and San Bernardino
Note: “r” = revised
Scheduled Date for Press Release:
03/19/17
Share this post
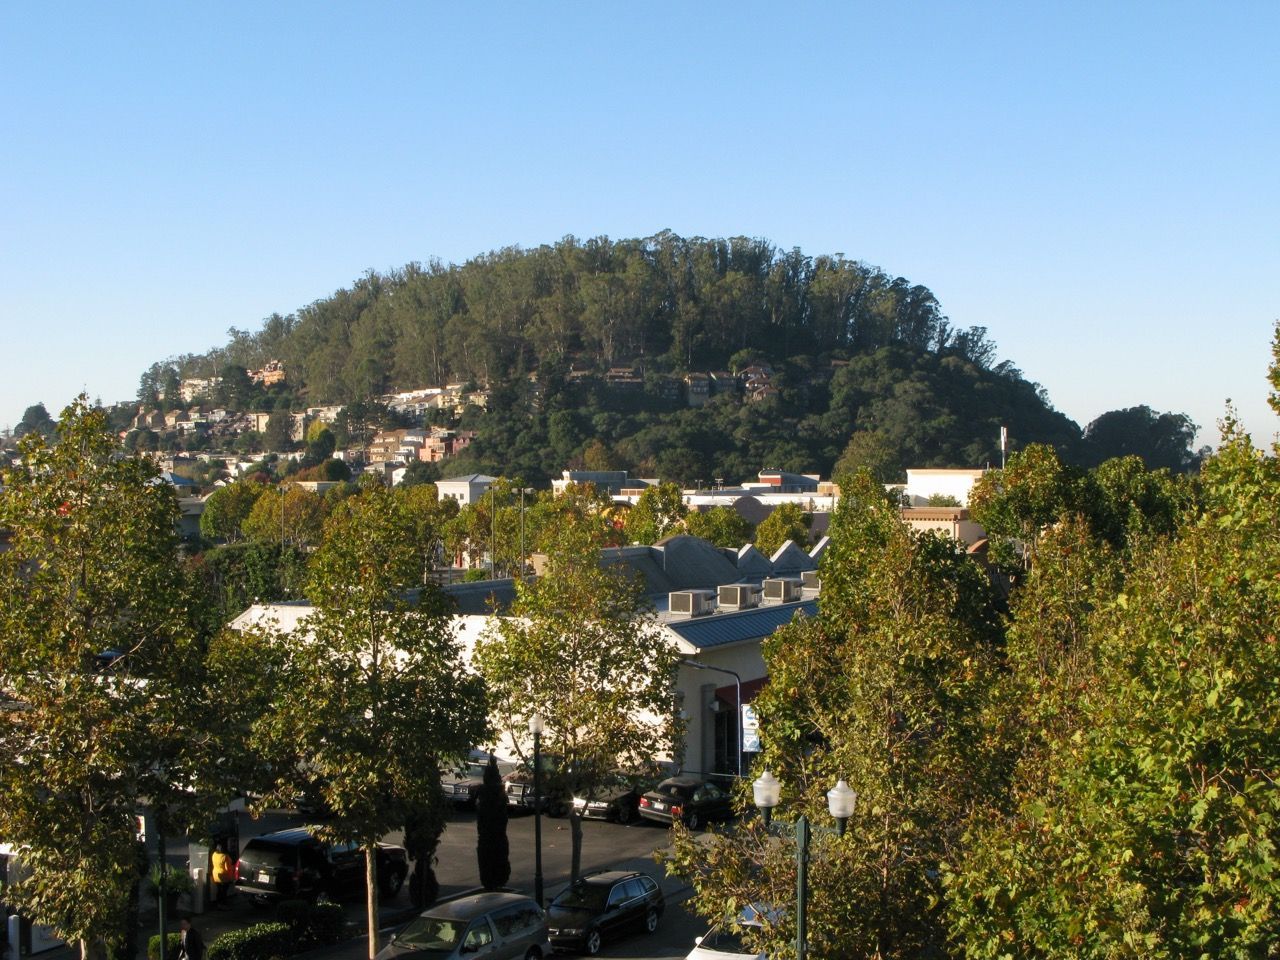
View of Albany Hill from El Cerrito Plaza Bart. This file is licensed under the Creative Commons Attribution-Share Alike 4.0 International license.
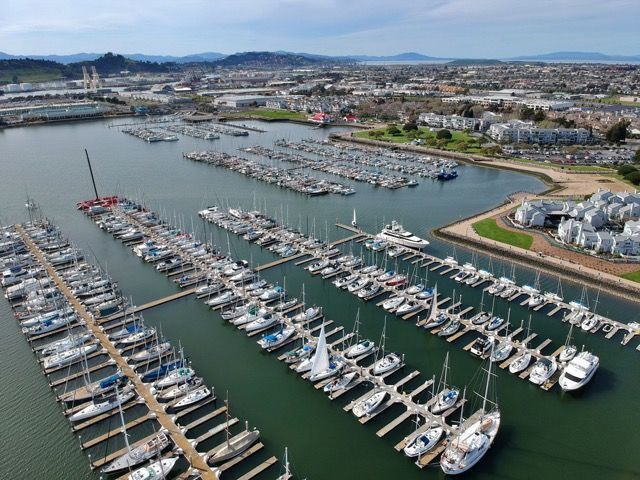
The Marina Bay neighborhood in Richmond, CA is one of Richmond's best real estate investment opportunities. Located along the city's southern waterfront, the neighborhood combines Bay views, parks and trails, relatively modern housing, convenient freeway access, and direct ferry service to San Francisco. For investors, Marina Bay also offers something less common in Richmond: a large concentration of modern condominiums and townhomes that can provide a lower entry point into Bay Area real estate than many nearby communities. Like any investment market, Marina Bay has advantages and potential drawbacks that buyers should understand before purchasing. Homeowner association expenses, rental restrictions, insurance, environmental history, seismic considerations, and Richmond's rental regulations can all affect the performance of an investment property. At the same time, continued investment along Richmond's waterfront and new employers moving into the area could create additional long-term opportunities. Why Choose Marina Bay for Real Estate Investing? Location is one of Marina Bay's greatest strengths. The neighborhood sits along Richmond's southern waterfront, offering residents access to the San Francisco Bay Trail, waterfront parks, marinas, restaurants, open space, and expansive views of the Bay. These amenities give Marina Bay a lifestyle that is unusual for a relatively affordable Bay Area community and can be especially attractive to renters and buyers who value outdoor recreation and waterfront living. Marina Bay is also one of Richmond's safest residential neighborhoods. While Richmond continues to contend with a reputation shaped partly by much higher crime rates in previous decades, public safety has improved substantially over time, and Marina Bay has consistently experienced relatively low crime compared with many other parts of the city. For buyers and renters unfamiliar with Richmond's individual neighborhoods, the difference between Marina Bay and perceptions of Richmond as a whole can be an important consideration. Marina Bay also benefits from the fact that many of the communities are gated and that the Richmond Police Department’s headquarters is located in the Marina Bay neighborhood. Transportation is another major advantage. Marina Bay is located close to Interstate 580, providing convenient connections to Marin County and to the rest of the East Bay. The Richmond Ferry Terminal, located adjacent to Marina Bay, provides weekday and weekend service to San Francisco's Ferry Building. Commuters to downtown San Francisco enjoy a convenient 35-minute ride to employment opportunities in the City, while other residents enjoy evening and weekend outings to the city for dinner and activities. The ferry's popularity demonstrates the value of that connection. During the first half of 2026, the Richmond route carried 205,545 passengers , averaging 1,254 weekday riders and 866 weekend riders . Ridership also increased during the period, from 29,203 boardings in January to 38,771 in June. For real estate investors, strong and growing ferry usage is noteworthy because convenient transportation to San Francisco can increase Marina Bay's appeal to professionals who want a waterfront East Bay lifestyle while maintaining access to one of the region's largest employment centers. What Is the History of Marina Bay? Understanding Marina Bay's history helps explain both the neighborhood's appeal and several issues investors should investigate before buying. Much of Richmond's southern waterfront was once devoted to heavy industry and shipbuilding. During World War II, Richmond became one of the nation's most important shipbuilding centers, with the Kaiser shipyards producing vessels for the war effort. The area that eventually became Marina Bay included portions of this former industrial waterfront. Beginning in the mid-1970s, Richmond's Harbor Redevelopment Project began transforming the old Inner Harbor Basin and former shipyard area into Marina Bay. The city envisioned a 350-acre master-planned waterfront community incorporating housing, commercial uses, a large marina, lagoons, parks, and waterfront promenades. The result is a neighborhood that feels quite different from Richmond's older residential districts. Much of the housing was constructed as part of planned developments, and landscaping, lagoons, walking paths, waterfront parks, and homeowner associations are prominent features of the community. The feel is more like Foster City or the newer developments in Alameda than the rest of Richmond. The area's industrial past is also important for investors to understand. Portions of the broader Marina Bay redevelopment area have environmental land-use restrictions related to former industrial uses. The City of Richmond identifies nine deed-restricted areas where certain work is subject to land-use covenants and California Department of Toxic Substances Control requirements. The areas with homes were remediated, but we recommend property-specific due diligence.
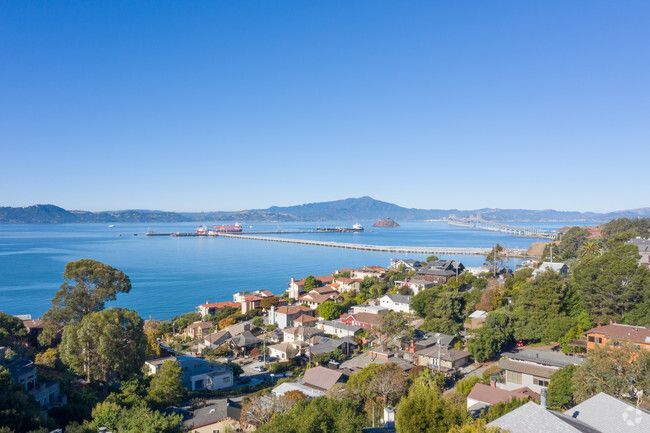
Thinking about buying a home to rent in Richmond, CA? Here's what to consider.